What If The Marcellus Shale Gas Play Doesn’t Pan Out?
For the gas industry and some utilities that are racing to build as much gas infrastructure as possible, there’s a lot riding on a shale gas ‘play’ known as the Marcellus. For those who aren’t buried in natural gas minutiae, a ‘play’ is an area where there’s lots of fracking for natural gas.
U.S. shale gas production (i.e. from hydraulically fractured wells) has grown steeply over the past 17 years and is now 67% of total U.S. natural gas.
Gas prices have historically been extremely volatile, but gas companies and utilities are saying that it will stay low for a long time – almost indefinitely – and they base much of that argument on the Marcellus, the largest source of fracked gas in the U.S.
The cost of natural gas is extremely volatile
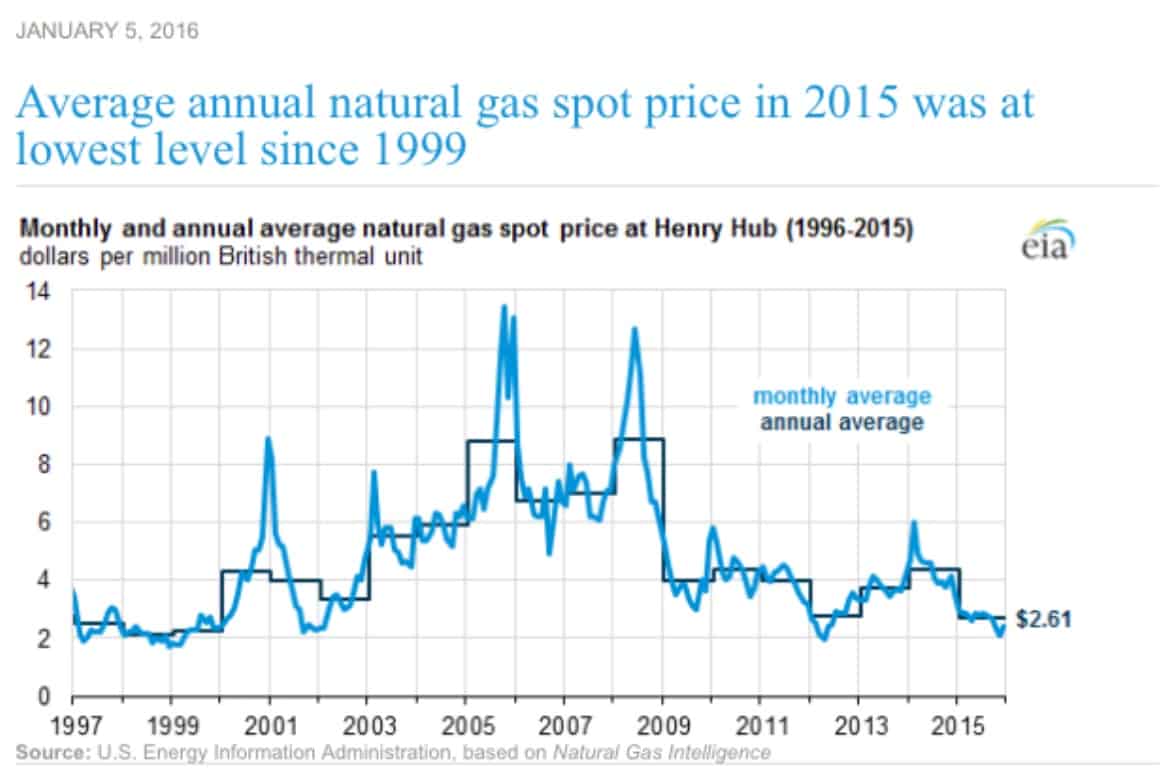
The cost of natural gas has always been volatile, and its price has been a roller-coaster ride for the past decade. Duke Energy’s former CEO, Jim Rogers, famously called it the “crack cocaine” of the power industry. And because the cost of fuel is what’s known as a ‘pass-through,’ electricity customers reimburse the utility for its fuel costs. This means that utilities, and their shareholders, don’t really have skin in the game when it comes to fuel costs. And in 2014 alone, electric utilities around the U.S. spent $42.4 billion purchasing natural gas for electric power plants (and another $39 billion for coal).
The chart below shows the volatility of natural gas since 1997. The two biggest spikes are Hurricane Katrina (August 2005) and the run-up in oil and gas costs which peaked in July 2008 with oil at $147/barrel, and natural gas at $13/MMBtu.

Key to understanding natural gas price volatility: it’s priced at the margin, and utilities only hedge a year or so in advance
One of the keys to understanding natural gas pricing is that it’s priced ‘at the margin.’ In plain language, this means that today’s price reflects the immediate past and the immediate future. Due to the volatility of gas prices, prices for natural gas are usually only ‘hedged’ (i.e. ‘locked in’) a year or less in advance. In Florida, utilities paid $6 billion too much for natural gas over a 15 year period after the price of gas crashed. So while hedging gas can save money over certain time periods, it can also be a big money-loser.
This means that beyond the one year when gas prices are hedged, consumers must pay whatever the gas costs, no matter what. And because fuel costs are ‘pass-throughs,’ if the utility’s cost estimates are off, it’s the customers who pay, not the utility or shareholders.
Despite the volatility of natural gas prices, EIA assumes natural gas at $5/MMBtu from 2030 to 2040
Despite the extreme ups and downs of natural gas pricing, the EIA’s 2017 Annual Energy Outlook (AEO2017) projects that the cost of natural gas will remain at bargain-basement levels from 2030 to 2040 at $5.00 per MMBtu. This is 20% below what EIA forecast in its 2015 Annual Energy Outlook (AEO2015) price forecast over the 2015-2040 period.
Average decline rate for shale gas well is 75-85% over first three years
While the increase in U.S. shale gas production is stunning, so are the decline rates for individual wells, which average 75-85% decline over the first three years. As geoscientist David Hughes points out, a steep decline rate for each well means that 30-45% of a play’s production must be replaced each year by more drilling. In some areas of the U.S., spacing of gas wells has dropped from 1 well pad per 240 acres to 1 well pad per 10 acres.
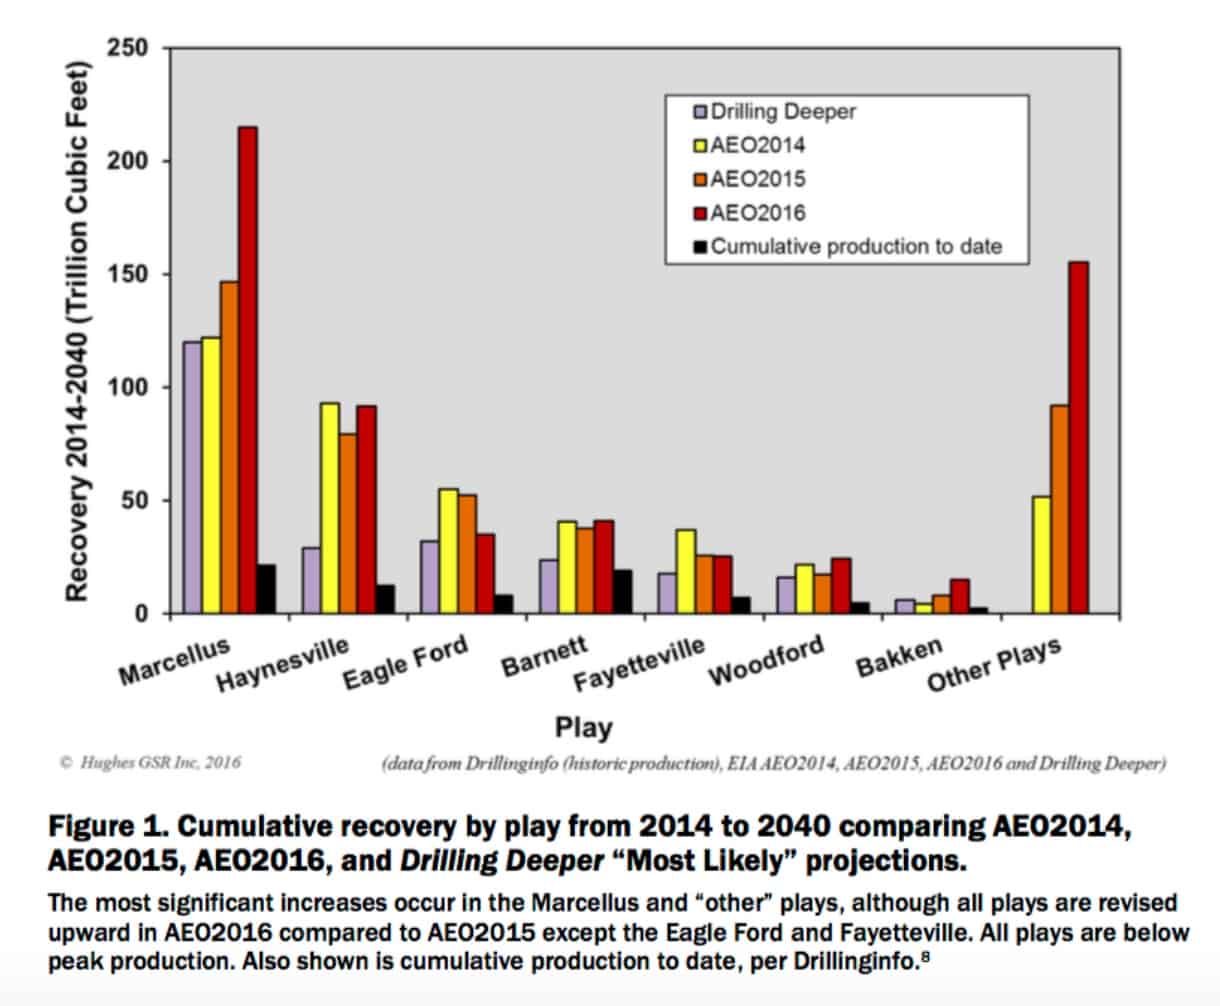
A good example is the Haynesville shale play, which started at nearly zero in 2006, and shot up quickly until peaking in early 2012. As of 2017, the Haynesville is down by 52%. Despite the obvious decline in production, the EIA recently predicted an ever-higher output from the Haynesville, so that it will nearly double its 2012 peak and continue producing gas past 2040.
What about the Marcellus?
The Marcellus shale play currently provides over a third of total U.S. shale gas produced, and is mainly in Pennsylvania but also includes eastern Ohio, northern West Virginia, and southern New York state. The top five shale-producing counties in Pennsylvania have accounted for 65% of cumulative production from the Marcellus play, demonstrating the fact that most gas is produced from a few “sweet spots.”
The EIA’s overblown estimate of future gas supplies is higher for the Marcellus shale than any other play.
The chart below, Figure 1 from Hughes’ 2016 study, shows the estimated recovery for several plays from the EIA’s Annual Energy Outlook (AEO) for 2014, 2015 and 2016. The 2016 estimate for the Marcellus play, in red, shoots up higher than any other play in the U.S., and is in fact 76% higher than the AEO2014 estimate. Note that the short black bar on the right is actual gas recovery. The AEO2016 estimate is also triple the estimate by the U.S. Geological Survey.
One constraint that’s seldom mentioned is geological: many sweet spots already have so many wells that it’s impossible to drill more wells without draining gas from adjacent wells, known as “well saturation.”
During 2014 ‘Polar Vortex’ wind power saved customers $1 billion over two days
Can clean energy really save money compared to natural gas fuel costs?
In early January 2014, an event called the ‘Polar Vortex’ plunged the Northeast and Great Lakes region into a bitter cold. During those two days, as the cost of natural gas on the spot market skyrocketed to meet the huge demand, wind energy saved customers a stunning $1 billion over two days.
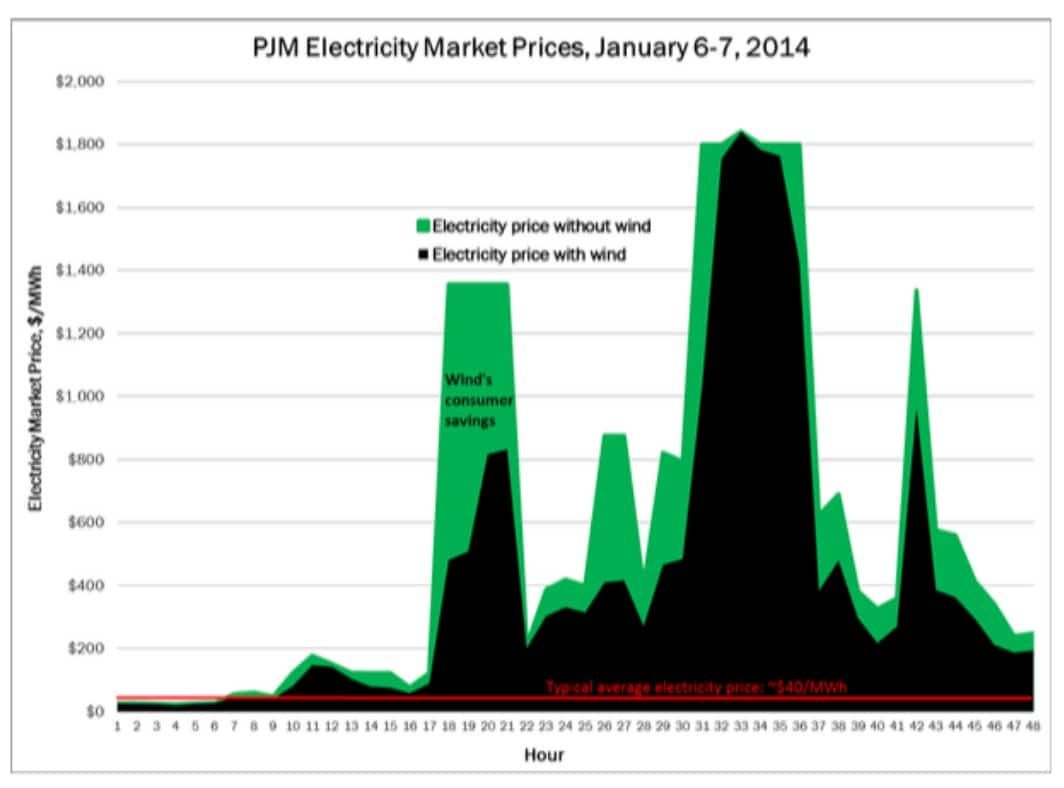
A more recent study by Synapse Energy Economics reports that if the use of wind energy doubled in the PJM Interconnection beyond current requirements, 12 states would save customers $7 billion per year, in part because wind energy would displace the need to purchase fuel.
Where is the U.S. today on natural gas production?
The latest numbers from the EIA report that year over year, U.S. natural gas production — and oil production — decreased from 2015 to 2016. Whether this trend continues or is merely a temporary decline, is yet to be seen.
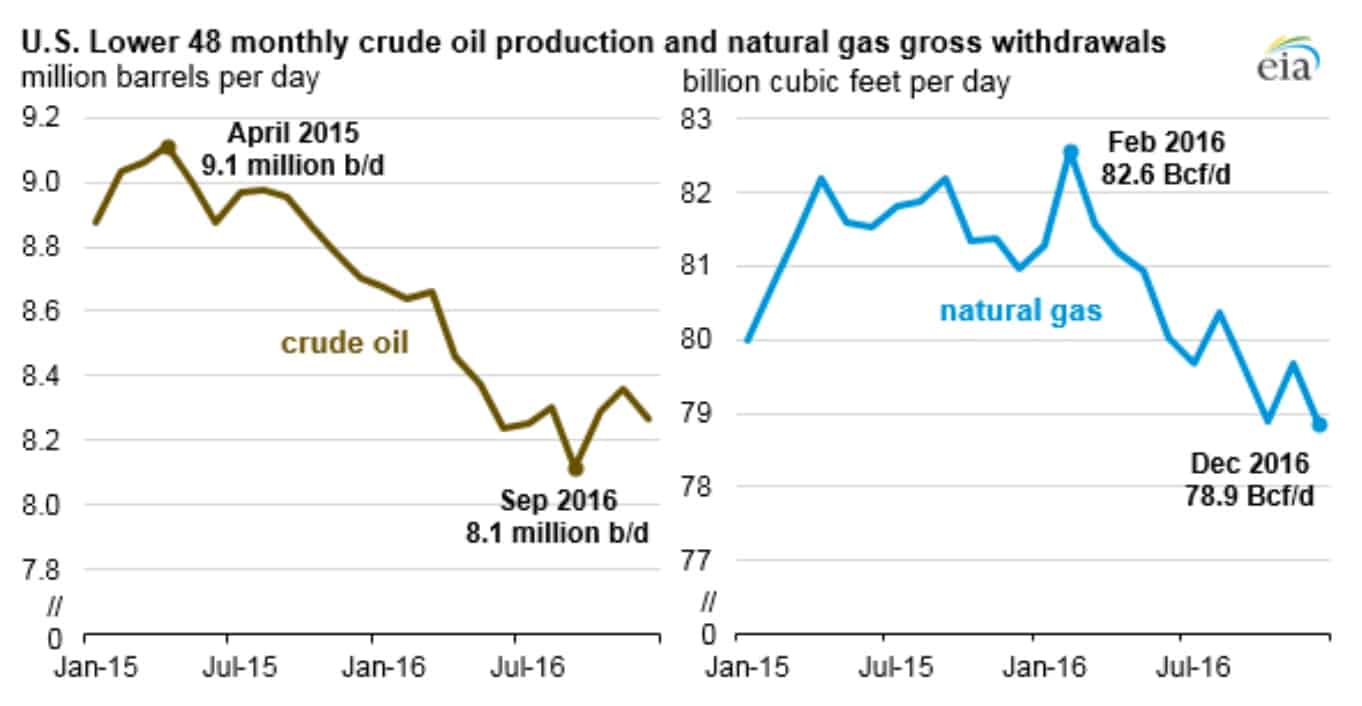
But it’s certainly worth watching. Any decreases in production might signal higher prices down the road, calling into question all of the math utilities are using to justify their massive investments in gas pipelines and power plants.
Update: On April 27, Bloomberg reported that the Marcellus Shale is producing about half of what it yielded a year ago. Reporters Christine Buurma and Naureen Malik write:
“The number of rigs drilling for gas has almost doubled since August, but output continues to fall. Even accounting for a lag between the start of drilling and first production, the drop in output is striking — a well in the Marcellus Shale, America’s most prolific reservoir of the fuel, is producing about half of what it yielded a year ago, according to Bloomberg Intelligence.
Companies are struggling to overcome steep decline rates — the natural decrease in production — from shale formations that were the source of huge added supplies in years past. The slowdown could signal an end to a glut that’s sent prices down 12 percent since the beginning of the year, making gas one of the worst performers in the Bloomberg Commodity Index.”


